Vancouver, B.C. – Maxus Mining Inc. (“Maxus” or the “Company”) (CSE: MAXM | OTCQB: MXMGF | FRA: R7V) is pleased to provide a summary of analytical results from the 2025 field program at its Quarry Antimony Property (the “Project” or the “Property”), located in the Omineca Mining District in British Columbia (Please see Figure 1). Maxus engaged Palliser Exploration Ltd. (“Palliser”) to complete a reconnaissance field program across the Project in autumn 2025. The second batch of sample results from the 2025 exploration and sampling program (the “Program”)at the Project is summarized below (Please see Figure 2).
Quarry Project 2025 Field Program Highlights
- Strong Polymetallic Signatures: Recent resultsverify the polymetallic signature on the Project characterized in previous exploration programs, with several outcrop and grab samples returning significant anomalous values for silver (Ag), zinc (Zn), and lead (Pb) with associated antimony (Sb).
- Rock Sample Assay Highlights:
- 60.8 g/t Ag, 3.36% Zn, 4.09% Pb, in Sample G019851; and
- 23.7 g/t Ag, 10.5% Zn, 1.92% Pb, in Sample G019857.
- Previously Reported Rock Sample Assay Highlights:
- 234 g/t Ag, 110 ppm Sb, 0.46% Zn, 4.67% Pb, in Sample G019834;
- 121 g/t Ag, 67 ppm Sb, 0.74% Zn, 2.35% Pb, in Sample G019827;
- 52.1 g/t Ag, 68 ppm Sb, 9.62% Zn,0.75% Pb, in Sample G019831;
- 11.1 g/t Ag, 2.83% Zn,0.36% Pb, in Sample G019828;
- 10.5 g/t Ag, 4.39% Zn, 2.38% Pb, in Sample G019854;
- 9.4 g/t Ag, 4.86% Zn,0.597% Pb, in Sample G019833; and
- 7.1 g/t Ag, 2.39% Zn,0.26% Pb, in Sample G019853.
- Extension of Mineralization: 2025 grab samples extend the footprint of polymetallic mineralization in the northeast corner of the Project to over 350 metres in strike length.
- Strategic Location: The Project is located approximately twenty-eight (28) km northwest of Germansen Landing, British Columbia, with favourable carbonate and dolomite breccia host rocks that are prospective for polymetallic mineralization.
Quarry Project Historical Highlights
- Historical samples from the 1990s assayed 0.89 g/t Au, 3.8% Cu, 0.34% Zn, 42.5% Pb, 0.65 g/t Ag, and 20% Sb1.
- Historical grab samples from 1954 yielded assays averaging 83.5% Pb and 1,576 g/t Ag1.
- Historic Silver, Lead, and Zinc Estimates of the Bullseye Zone (NI 43-101 non-compliant):
- 99,781 tonnes @ 1.42% Pb, 2.24% Zn, 36.3 g/t Ag (drill-indicated);2
- 2.72 Mt @ 3.66% Pb + Zn, 36.3 g/t Ag (original category not classified, three zones);2
- Historical block estimate, parameters unknown; and
- Please see paragraph below (Comments on Reliability of Historical Estimate).
“The results from this second phase of sampling at the Project build directly on our initial findings and continue to demonstrate the strength and consistency of the polymetallic system,” said Scott Walters, Chief Executive Officer of Maxus Mining Inc. “We are particularly encouraged by the extension of mineralization along a defined structural trend at the Bullseye Zone, which highlights the growing scale potential at the Project. These outcomes are helping to refine our understanding of the system and will guide the next phase of targeted exploration.”
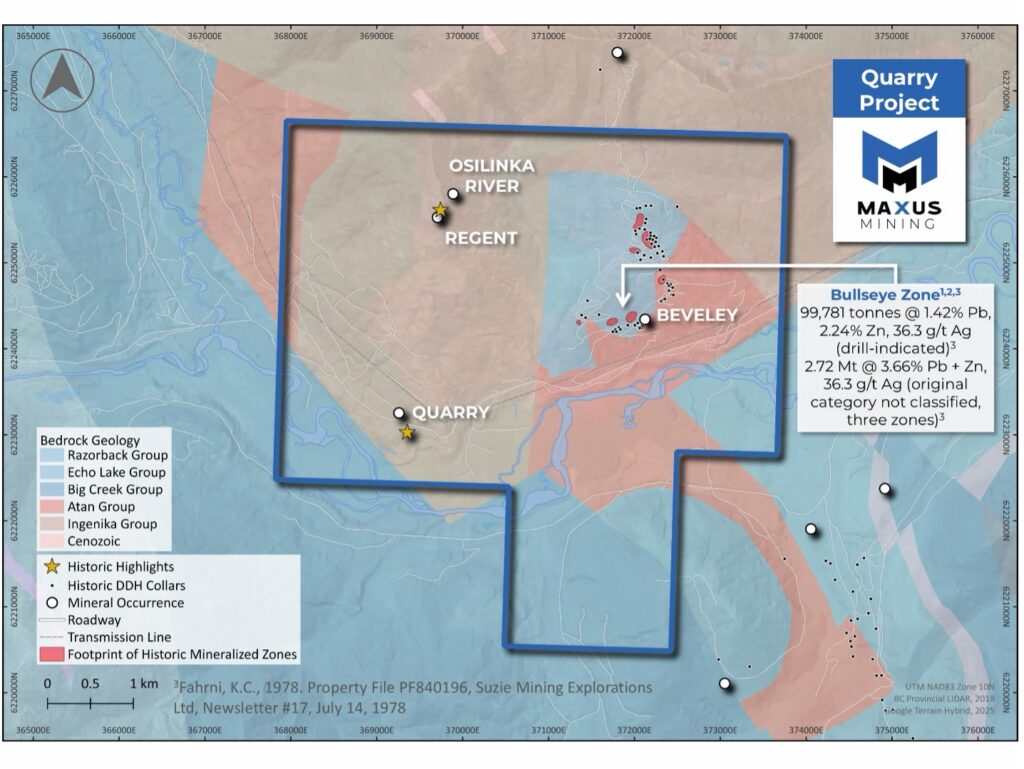
Figure 1: Quarry Project Tenure Map Highlighting the Historic Bullseye Zone
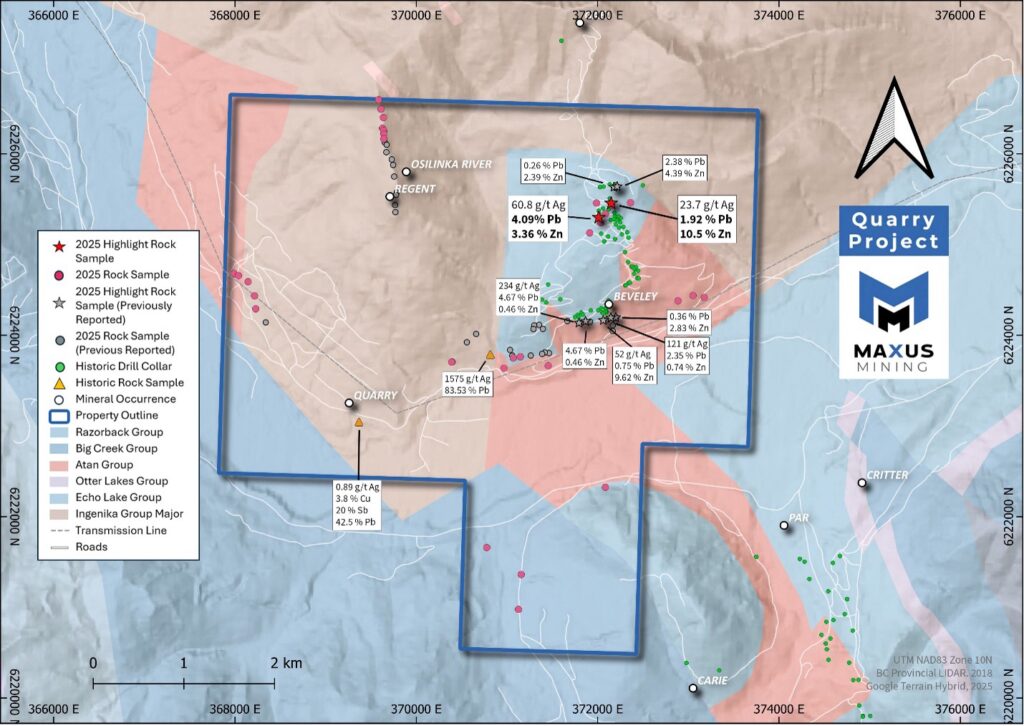
Figure 2: Quarry Antimony Property Outlining Historic Showings, Historic Assays and 2025 Program Highlights
2025 Quarry Exploration Program
Combined assay results from the 2025 Program define two localized and well-developed polymetallic mineralization trends, dominated by silver, lead, and zinc as previously identified at the Property.1,2,3 Of the sixty-five (65) samples, nine (9) samples (comprising 12% of samples) exhibit pronounced multi-element enrichment that clearly stands out from the broader dataset. Table 1 presents selected assay results for samples collected during the Program.
Two highlighted samples reported in this release, G019851 and G019857, were collected in the northeast corner of the Project and returned elevated lead and zinc values, up to 4.09% Pb and 10.5% Zn (Please see Table 1 and Figure 2). These samples extend a NE–SW-trending zone of polymetallic mineralization over 350 m in length (Please see Figure 2). The samples were taken from sandstone outcrop and subcrop along an exposed ridge. The samples displayed common quartz veining, silicification, and base metal mineralization.
Overall, the geochemical results support interpretation of structurally controlled Ag–Pb–Zn ± Sb vein systems, with sharp geochemical contrasts indicating strong structural concentration of metals. These characteristics support the prioritization of detailed structural mapping and targeted sampling along known structural trends, specifically the E–W 450 m shear zone located in the southeast portion of the Property and the NE–SW mineralized trend in the northeast (Please see Figure 2).
Table 1: 2025 Quarry Program Assay Highlights**
| Sample ID | Easting | Northing | Elevation | Au g/t | Ag g/t | Cu ppm | Mo ppm | Pb ppm | Sb ppm | Zn ppm |
| G019802 | 367989 | 6224681 | 941 | 0.00 | 0.5 | 1.8 | 0.8 | 3 | 2 | 9 |
| G019803 | 368037 | 6224657 | 946 | 0.00 | 0.5 | 1.2 | 0.5 | 2 | 2 | 2 |
| G019804 | 368144 | 6224590 | 961 | 0.02 | 0.5 | 5.6 | 0.6 | 4 | 4 | 12 |
| G019805 | 368215 | 6224435 | 934 | 0.00 | 0.5 | 1.7 | 0.6 | 138 | 4 | 13 |
| G019806 | 368228 | 6224291 | 905 | 0.00 | 0.5 | 2.6 | 0.5 | 3 | 2 | 17 |
| G019811 | 370394 | 6223705 | 933 | 0.00 | 0.5 | 8.7 | 1.2 | 8 | 2 | 57 |
| G019812 | 370390 | 6223704 | 933 | 0.01 | 0.5 | 29.3 | 0.7 | 14 | 5 | 261 |
| G019813 | 371454 | 6223663 | 888 | 0.00 | 0.5 | 0.9 | 0.5 | 8 | 2 | 20 |
| G019818 | 371147 | 6223763 | 960 | 0.00 | 0.5 | 0.5 | 0.8 | 2 | 2 | 4 |
| G019821 | 371070 | 6223749 | 963 | 0.17 | 0.5 | 8.1 | 2.4 | 63 | 16 | 47 |
| G019823 | 370965 | 6223637 | 897 | 0.00 | 0.5 | 0.7 | 2.3 | 14 | <1 | 60 |
| G019841 | 373176 | 6224414 | 924 | 0.01 | 0.5 | 4.5 | 0.7 | 25 | 1 | 33 |
| G019842 | 373051 | 6224437 | 987 | 0.00 | 0.5 | 0.5 | 0.5 | 9 | <1 | 19 |
| G019843 | 372885 | 6224380 | 1004 | 0.01 | 0.5 | 2.2 | 0.5 | 59 | 2 | 34 |
| G019844 | 371156 | 6221361 | 974 | 0.01 | 0.5 | 2.6 | 80.2 | 13 | 7 | 87 |
| G019845 | 371127 | 6220977 | 1003 | 0.00 | 0.5 | 2.8 | 4.0 | 8 | 1 | 71 |
| G019846 | 370776 | 6221658 | 909 | 0.01 | 0.5 | 10.6 | 2.1 | 30 | <1 | 54 |
| G019847 | 372085 | 6222324 | 883 | 0.00 | 0.5 | 2.0 | 0.5 | 60 | <1 | 24 |
| G019848 | 371912 | 6225129 | 1355 | 0.00 | 0.5 | 4.0 | 0.5 | 75 | 2 | 20 |
| G019849 | 372036 | 6225238 | 1405 | 0.00 | 0.5 | 3.6 | 0.5 | 64 | 3 | 70 |
| G019851 | 372012 | 6225298 | 1418 | 0.00 | 60.8 | 61.3 | 0.5 | 40,900 | 7 | 33,600 |
| G019852 | 371988 | 6225457 | 1451 | 0.00 | 0.5 | 1.7 | 0.5 | 324 | 2 | 282 |
| G019855 | 372362 | 6225462 | 1461 | 0.00 | 0.5 | 2.6 | 0.5 | 94 | <1 | 153 |
| G019856 | 372152 | 6225433 | 1460 | 0.00 | 0.5 | 1.5 | 0.5 | 53 | <1 | 80 |
| G019857 | 372149 | 6225455 | 1463 | 0.01 | 23.7 | 63.4 | 0.8 | 19,200 | 15 | 105,000 |
| G019858 | 372087 | 6225338 | 1432 | 0.00 | 0.5 | 2.7 | 0.5 | 92 | 1 | 471 |
| G019859 | 369584 | 6226596 | 1725 | 0.00 | 0.5 | 0.5 | 0.5 | 47 | <1 | 123 |
| G019861 | 369610 | 6226492 | 1703 | 0.00 | 0.5 | 1.0 | 0.5 | 9 | 2 | 13 |
| G019862 | 369637 | 6226400 | 1686 | 0.00 | 0.5 | 0.5 | 0.5 | 6 | 2 | 17 |
| G019863 | 369627 | 6226282 | 1674 | 0.00 | 0.5 | 27.2 | 0.5 | 27 | 5 | 146 |
| G019864 | 369640 | 6226256 | 1668 | 0.00 | 0.5 | 0.5 | 0.5 | 6 | 2 | 10 |
| G019865 | 369643 | 6226219 | 1664 | 0.00 | 0.5 | 1.0 | 0.5 | 4 | 3 | 5 |
| G019866 | 369641 | 6226166 | 1664 | 0.00 | 0.5 | 0.5 | 0.5 | 4 | 2 | 6 |
**All sample values are from grab samples which by their nature, are not representative of overall metal grades of mineralized areas. Readers are cautioned to not place undue reliance on the assay values reported in the table above. The samples above are part of a suite of sixty-five (65) samples collected and assayed during the Program.
Sample Preparation and Analytical Procedures
Rock samples were collected by Palliser field crews with sample locations (in NAD83 UTM Zone 10 coordinates), descriptions, visual characteristics, and photographs recorded in the field. Each sample was assigned a unique sample ID and placed into a labelled sample bag along with a corresponding sample tag. Samples were stored securely during the Program and transported directly by Palliser personnel to AGAT Laboratories in Calgary, Alberta for sample preparation and geochemical analysis. AGAT Laboratories is accredited to ISO 9001:2015 and ISO/IEC 17025 for specific analytical methods.
The following sample preparation, analysis, and quality assurance and quality control methods were performed:
- Dry <5kg, Crush to 75% passing 2mm, split to 250g (method code 200-075)
- Pulverize to 85% passing 75 microns (method code 200-087)
- Metals by 4 Acid Digestion, Inductively Coupled Plasma-Optical Emission Spectrometry (ICP-OES) (201-070)
- Gold (Au) by fire assay (202-551)
- If Au >10g/t, run gravimetric 202-564
- If metals were above the upper detection limit, ran overlimit 4 Acid Digestion, ICP-OES or ICP-Mass Spectrometry (MS)
- A Certified Reference Material or Blank was inserted at a frequency of one (1) in ten (10) samples.
A minimum of two (2) Maxus personnel received all AGAT Laboratories assay certificates.
Comments on Reliability of Historical Estimate
The historical estimate for the Property is sourced from Property File PF840196, Suzie Mining Explorations Ltd. Newsletter No. 17, prepared by Keith C. Fahrni, P.Eng., and dated July 14, 1978. The estimate is historical in nature and does not include the parameters or categories required under current CIM Definition Standards. There are no directly comparable CIM categories that can be attributed to this estimate, and to the knowledge of the Qualified Person (“QP”), no modern mineral resource or reserve estimates exist for the Property. A QP has not completed sufficient work to classify the historical estimate as current mineral resources or mineral reserves, and the Company is not treating the historical estimate as current mineral resources or mineral reserves.
Work required to upgrade and verify the historical estimate includes a desktop compilation of historical drill data, confirmatory/twin drilling at appropriate spacing, specific-gravity (“SG”) testing by domain, modern analytical QA/QC with check assays, validation of collar locations and downhole surveys, development of a 3D geological/grade model, and QP verification to CIM standards.
Qualified Person Statement
The scientific and technical information contained in this news release has been reviewed, verified, and approved by Morgan Verge, P.Geo., VP Exploration of the Company and a “Qualified Person” as defined in NI 43-101 – Standards of Disclosure for Mineral Projects (“NI 43-101”). Ms. Verge has examined information regarding the historical exploration at the Project, which includes a review of the historical sampling and analytical procedures underlying the information and opinions contained herein.
Management cautions that historical results collected and reported by operators unrelated to Maxus have not been verified nor confirmed by its Qualified Person; however, the historical results create a scientific basis for ongoing work at the Project. Management further cautions that historical results, discoveries and published resource estimates on adjacent or nearby mineral properties, whether in stated current resource estimates or historical resource estimates, are not necessarily indicative of the results that may be achieved on the Project.
The “Historic Estimate” described above falls under the NI 43-101 definition of a “historic estimate” meaning that the calculations were prepared prior to the February 1st, 2001 implementation of NI 43-101 and therefore do not conform to NI 43-101 standards. No NI 43-101 compliant resource estimates exist to date on the Property.
About Maxus Mining Inc.
Maxus Mining Inc. (CSE: MAXM | OTCQB: MXMGF | FRA: R7V) is a mineral exploration company focused on locating, acquiring, and, if warranted, advancing economic mineral properties in premier jurisdictions. The Company is actively progressing its diversified portfolio totaling approximately 15,098 hectares of prospective terrain across British Columbia, Canada.
The Portfolio includes 8,920 hectares across three antimony projects, anchored by the flagship Alturas Antimony Project, where recent work returned high-grade naturally occurring antimony up to 69.98% Sb¶. The Hurley Antimony Project, located adjacent to Endurance Gold Corp.’s Reliance Gold Project, where 2024 drilling reported 19.2% Sb and 2.16 g/t Au over 0.5 m‖, and the Quarry Antimony Project, which hosts historical polymetallic samples grading 0.89 g/t Au, 3.8% Cu, 0.34% Zn, 42.5% Pb, 0.65 g/t Ag, and 20% Sb‡.
Maxus’ portfolio further includes the 3,054-hectare Lotto Tungsten Project, where a selected 1980 grab sample from a scheelite-bearing quartz vein assayed 10.97% WO₃§, and the 3,123-hectare Penny Copper Project, which has over 100 years of recorded exploration. Recent work programs at Penny included rock sampling and geological mapping†, with 2017 sampling returning copper values of 1046 ppm Cu (TK17-149c), 1808 ppm Cu (TK17-28), and 2388 ppm Cu (TK17-12)†. The Project is strategically located near the historic Sullivan Mine at Kimberley, British Columbia, an area that continues to attract significant exploration activity.
Maxus Mining is committed to advancing its British Columbia projects through targeted exploration programs designed to unlock value across multiple critical mineral systems.
References
1 Geological Survey of Canada Memoir – MINFILE No. 094C104 EMPR OF *1992-11; 1993-2 Open File 1992-11, Map Number 10 BCGS
2 Property File PF840196, Suzie Mining Explorations Ltd. Newsletter No. 17, prepared by Keith C. Fahrni, P.Eng., and dated July 14, 1978 Link
3 Maxus Mining Corp. (2025). Maxus Mining highlights historical polymetallic results at the Quarry Project in British Columbia, Canada [news release]. https://maxusmining.com/maxus-mining-highlights-historical-polymetallic-results-at-the-quarry-project-in-british-columbia-canada/
¶Equinox Resources – November 8, 2024, ‘Ultra High Grade Naturally Occurring Antimony at Alturas Project with Assays up to 69.98% Sb’ – Link
‖ Endurance Summarizes Antimony Results From The Reliance Gold Project, BC – Best Intervals Include 19.2% Antimony And 2.16 ppm Au Over 0.5 m In 2024 Drilling – February 24, 2025 – Link
‡ Open File 1992-11, Map Number 10.
§ MINFILE No: 082FSW228 – Loto 3, 1980 Grab Sample Link
† NI 43-101 – Technical Report on the Penny Property British Columbia, NTS 82G/12 49° 55° North Latitude -115° 90° West Longitude, Derrick Strickland P.Geo., August 14, 2024.
On Behalf of the Board of Directors
Scott Walters
Chief Executive Officer, Director
+1 (778) 374-9699
info@maxusmining.com
Disclaimer for Forward-Looking Information
This news release includes certain “Forward-Looking Statements” within the meaning of the United States Private Securities Litigation Reform Act of 1995 and “forward-looking information” under applicable Canadian securities laws. When used in this news release, the words “anticipate”, “believe”, “estimate”, “expect”, “target”, “plan”, “forecast”, “may”, “would”, “could”, “schedule” and similar words or expressions, identify forward-looking statements or information.
Forward-looking statements and forward-looking information relating to any future mineral production, liquidity, enhanced value and capital markets profile of Maxus’, future growth potential for Maxus and its business, and future exploration plans are based on management’s reasonable assumptions, estimates, expectations, analyses and opinions, which are based on management’s experience and perception of trends, current conditions and expected developments, and other factors that management believes are relevant and reasonable in the circumstances, but which may prove to be incorrect. Assumptions have been made regarding, among other things, the price of copper, gold, tungsten, antimony and other metals; costs of exploration and development; the estimated costs of development of exploration projects; Maxus’ ability to operate in a safe and effective manner and its ability to obtain financing on reasonable terms.
This news release contains “forward-looking information” within the meaning of the Canadian securities laws. Statements, other than statements of historical fact, may constitute forward looking information and include, without limitation, statements with respect to the Project and its mineralization potential; the Company’s objectives, goals, or future plans with respect to the Project; further exploration work on the Project in the future; and the expected benefits of completing the Program. With respect to the forward-looking information contained in this news release, the Company has made numerous assumptions regarding, among other things, the geological, metallurgical, engineering, financial and economic advice that the Company has received is reliable and are based upon practices and methodologies which are consistent with industry standards. While the Company considers these assumptions to be reasonable, these assumptions are inherently subject to significant uncertainties and contingencies. Additionally, there are known and unknown risk factors which could cause the Company’s actual results, performance or achievements to be materially different from any future results, performance or achievements expressed or implied by the forward-looking information contained herein. Known risk factors include, among others: fluctuations in commodity prices and currency exchange rates; uncertainties relating to interpretation of well results and the geology, continuity and grade of copper, gold, tungsten, antimony and other metal deposits; uncertainty of estimates of capital and operating costs, recovery rates, production estimates and estimated economic return; the need for cooperation of government agencies in the exploration and development of properties and the issuance of required permits; the need to obtain additional financing to develop properties and uncertainty as to the availability and terms of future financing; the possibility of delay in exploration or development programs or in construction projects and uncertainty of meeting anticipated program milestones; uncertainty as to timely availability of permits and other governmental approvals; increased costs and restrictions on operations due to compliance with environmental and other requirements; increased costs affecting the metals industry and increased competition in the metals industry for properties, qualified personnel, and management. All forward-looking information herein is qualified in its entirety by this cautionary statement, and the Company disclaims any obligation to revise or update any such forward-looking information or to publicly announce the result of any revisions to any of the forward-looking information contained herein to reflect future results, events or developments, except as required by law.
The Canadian Securities Exchange (CSE) does not accept responsibility for the adequacy or accuracy of this release.